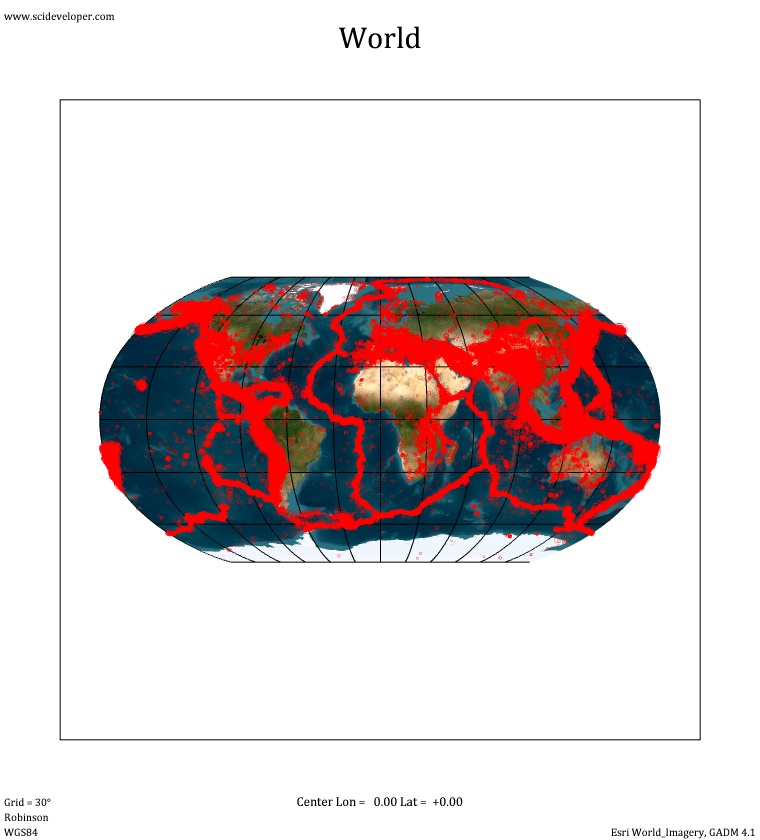
Here I have fit earthquake frequency statistics to seismic regions.
The upper magnitude limits are poorly determined, many faults will have physical limits to the maximum magnitude quakes possible.
Unfortunately there is not enough data to find the roll-off in most cases.
M2.5 : 46.8 s
M3.0 : 2.55 m
M3.5 : 8.34 m
M4.0 : 27.3 m
M4.5 : 1.49 h
M5.0 : 4.86 h
M5.5 : 15.9 h
M6.0 : 2.16 d
M6.5 : 7.08 d
M7.0 : 23.1 d
M7.5 : 75.7 d
M8.0 : 363 d
M8.5 : 4.78 y
M9.0 : 22.9 y
M9.5 : 110 y
M10.0 : 528 y
Based on 3,228,860 events. Largest M9.5
n = Events per year with magnitude >= M
M <= 7.5
log10(n) = 8.40 - 1.029*M
7.5 < M <= 10.0log10(n) = 10.90 - 1.362*M
Selected Major Regions
Alaska-Aleutians Region, USABlanco Transform Region, USA
Cascades Region, USA
Cayman Trench Region
Chile Trench Region
Gakkel Ridge, Arctic Ocean
Gulf of California Region, Mexico
Hawaii Region, USA
Helenic Trench
Himalayan Mountains Region
Hindu Kush Mountains Region
Iceland Region
Izu-Ogasawara Trench Region
Jan Mayen Region, North Atlantic
Japan Trench Region
Java Trench Region
Kermadec Trench Region
Knipovich Ridge, North Atlantic
Kuril-Kamchatka Trench Region
La Romanche Fracture Zone
Mariana Trench Region
Mendocino Region, USA
Middle America Trench Region
Mid-Atlantic Ridge
Nansei-Shoto Trench Region, Japan
New Britain/South Solomon Trench Region, Papua New Guinea
New Hebrides Trench Region, Vanuatu
New Madrid Region, USA
North Mid-Atlantic Ridge
Northern California Coast Region, USA
Oklahoma Region, USA
Pegunungan Mountains Region, Indonesia
Peru-Chile Trench Region
Philippine Trench Region
Puerto Rico Trench Region
Pyrenees Mountains Region
Queen Charlotte Region, Canada
Reykjanes Ridge, North Atlantic
Rocky Mountains Region, USA
Sweetwater Valley Tennessee Region, USA
Sierra Nevada Mountains Region, USA
South Mid-Atlantic Ridge
South Sandwich Trench Region, USA
Southern California Region, USA
Southwest Indian Ridge
Tibetan Plateau Region